The Performance Metrics Every QA Engineer Should Understand | Performance Testing Foundations | Friday # 2
23 October 2026
A load test report comes back green. Average response time is 420 ms, there are no errors, and the server handled 500 users. Everyone signs off.
Two weeks later, checkout stalls during a sale. Customers see spinners, support tickets pile up, and someone asks the QA team: “Didn’t we test this?”
You did. You just read the wrong numbers, or the right numbers measured the wrong way.
Performance testing is mostly an exercise in interpretation. Tools like JMeter, k6, Gatling and Locust will give you dozens of metrics. What matters is knowing which ones to trust, which ones lie, and how they connect.
This article covers the metrics that matter, what each one actually tells you, and how to read them together.
1. Response Time: Know What You’re Actually Measuring
“Response time” sounds simple, but at least three different things go by that name.
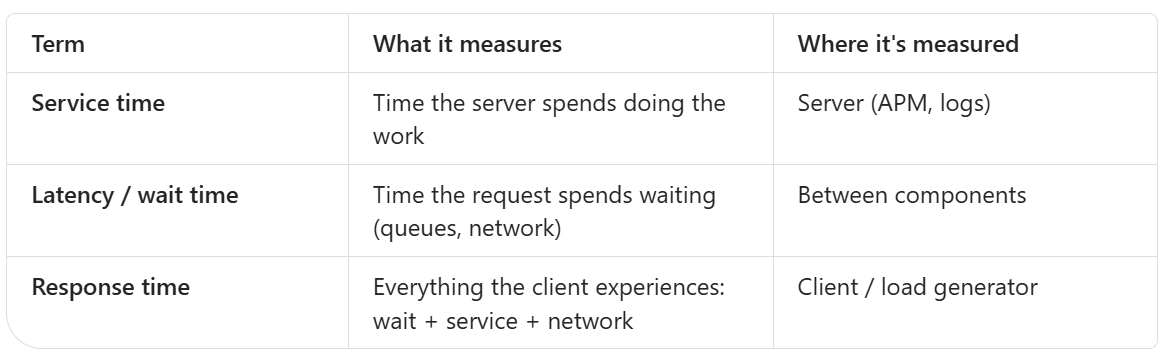
Users feel response time. Servers usually report service time.
That gap matters. If a request waits 3 seconds in a connection queue and then takes 50 ms to process, the server log shows 50 ms and the user experiences 3.05 seconds.
Practical rule: When the load tool and the APM disagree, the load tool is usually closer to what users feel. The difference between the two is often queueing, and that difference is the bottleneck you’re looking for.
Break the time down
Most tools split one request into phases:
DNS lookup
TCP connect
TLS handshake
Time to First Byte (TTFB): from sending the request to receiving the first byte back
Content download
In k6 these show up as http_req_connecting, http_req_tls_handshaking, http_req_waiting (TTFB) and http_req_receiving.
Why this matters:
High connect/TLS time often means connections aren’t being reused (keep-alive is off, or the test creates a new connection every iteration).
High TTFB means the server is slow to start responding: processing, DB calls or queueing.
High receiving time means a large payload or a slow network, not a slow backend.
When someone says “the API is slow,” the phase breakdown tells you which part is slow.
2. Percentiles: The Metric That Tells the Truth
averages hide pain, and percentiles expose it.
p50: the typical experience
p90/p95: what your slower-but-normal users see
p99: your tail, where queues, locks, GC pauses and cold caches show up
max: a single worst case. Useful for spotting timeouts, but noisy
Three mistakes QA reports make with percentiles
Mistake 1: Averaging percentiles. If you run 4 load generators and each reports its own p95, you cannot average those four numbers to get the overall p95. Percentiles have to be computed from the combined raw data or merged histograms. Most commercial and cloud tools handle this correctly. Hand-made Excel summaries often don’t.
Mistake 2: Trusting p99 with too few samples. p99 from 200 requests is basically the 2nd slowest request. For a stable p99 you want thousands of samples per endpoint. For p99.9, you need tens of thousands.
Mistake 3: Reporting one percentile across all endpoints. A combined p95 that mixes GET /health (5 ms) with POST /checkout (900 ms) is meaningless. Fast endpoints dilute slow ones. Always report percentiles per transaction or endpoint.
3. Coordinated Omission: When Your Load Tool Lies
This is the most important idea in this article that most QA engineers have never heard of.
Picture a closed-model test where each virtual user sends a request, waits for the response, then sends the next one.
Now the server freezes for 5 seconds.
What should happen: requests keep arriving during those 5 seconds, they all queue up, and they all record terrible response times.
What actually happens: every virtual user is stuck waiting, so no new requests are sent. The tool records a handful of slow requests instead of hundreds.
The tool has coordinated with the system under test and omitted the samples that would have looked bad. Your p99 looks far healthier than reality.
How to defend against it:
Use an open model (fixed arrival rate) for anything user-facing. In k6 that’s
constant-arrival-rateorramping-arrival-rate. In Gatling, use open injection likeconstantUsersPerSec.Watch whether the tool actually achieved the target rate. If you asked for 200 RPS and got 140, the system pushed back and that’s a finding, not noise.
In k6, check
dropped_iterations. If it’s above zero, the tool couldn’t keep up with your schedule.
If achieved throughput is lower than target throughput, your latency numbers are probably optimistic.
4. Throughput: Count the Right Thing
Throughput is work completed per unit of time. The trick is defining “work.”
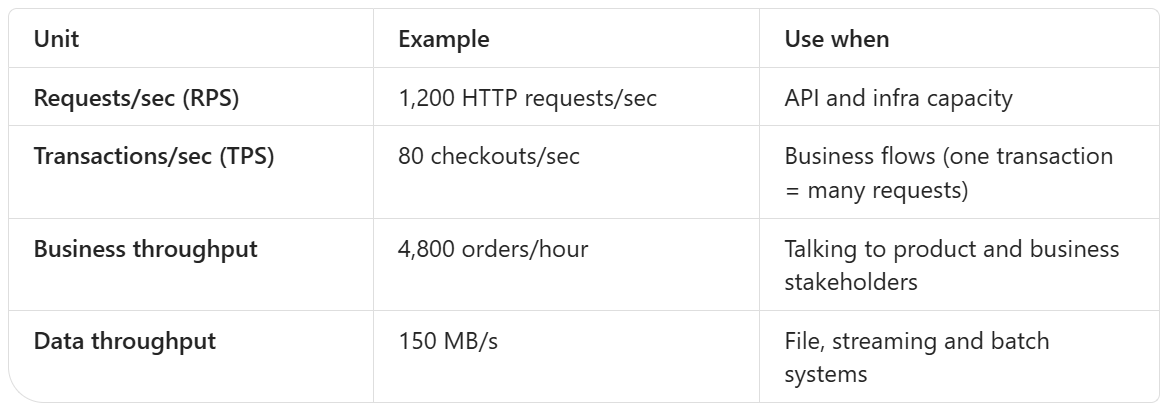
Goodput: throughput that actually counts
A system doing 1,000 RPS with 30% errors is not doing 1,000 RPS of useful work. It’s doing 700.
Goodput = successful requests per second.
Always report throughput alongside error rate, or report goodput directly. A system under stress often raises raw RPS because it’s failing fast, and fast failures are cheap.
Throughput tells you where the ceiling is
Plot throughput against load:
Throughput rises in line with load → you have headroom.
Throughput flattens while load keeps rising → you’ve hit saturation (the knee).
Throughput drops as load rises → the system is collapsing: thrashing, retry storms, lock contention.
The last pattern is the dangerous one. It means extra traffic makes the system do less work, and that’s how outages snowball.
5. Error Rate: It’s Not Just HTTP 500s
A 0% error rate in a report often means “we only checked status codes.”
Errors to count:
5xx responses: server failures
Timeouts: client-side or gateway (504). These are often missing from server logs entirely
Connection errors: refused, reset, pool exhausted
Wrong 4xx under load: 429 (rate limited), or 401 appearing because token refresh breaks under concurrency
Functional failures with a 200 status: empty search results,
{"status": "error"}in the body, a stale cached response, a missing order ID
That last category is where QA earns its keep. Add response checks to your load scripts.
check(res, {
  'status is 200': (r) => r.status === 200,
  'order id present': (r) => r.json('orderId') !== undefined,
  'no error in body': (r) => !r.body.includes('"error"'),
});
A system that returns fast, empty responses under load can look like a performance win. It’s actually a correctness bug.
Read errors over time, not as one total
“0.8% errors” across a 30-minute test can mean:
0.8% spread evenly → background flakiness
0% for 25 minutes, then 10% in the last 5 → the system broke at a specific load level
Always look at the error rate timeline next to the load timeline.
6. Concurrency, Arrival Rate and Little’s Law
Concurrency = Throughput × Response time
This formula is a sanity check on every test you run.
Example: You want 200 RPS and the response time is 0.5 s. Concurrency needed = 200 × 0.5 = 100 in-flight requests.
If you configured only 50 virtual users with no think time, you cannot reach 200 RPS. The most you’ll get is 50 ÷ 0.5 = 100 RPS. The test isn’t proving that the system caps at 100 RPS. It’s proving that your script caps at 100 RPS.
It works the other way too. If response time jumps from 0.5 s to 2 s at the same throughput, concurrency inside the system jumps from 100 to 400. Thread pools, connection pools and memory all feel that 4x jump. Slowness creates more concurrency, and more concurrency creates more slowness. That feedback loop is how systems tip over.
7. Resource Metrics: Finding the Why
Client-side metrics tell you what happened. Resource metrics tell you why.
Two frameworks make this manageable.
RED: for every service
Rate: requests per second
Errors: failed requests per second
Duration: latency distribution
That’s the user-facing view of each service.
USE: for every resource
For CPU, memory, disk, network, thread pools and connection pools:
Utilization: how busy it is (%)
Saturation: how much work is waiting (queue length)
Errors: failures on that resource
Saturation is the one people skip, and it’s the most useful. A CPU at 70% utilization with a run queue of 20 is in trouble. A DB connection pool at 100% with 0 waiters is fine. With 50 waiters, it’s your bottleneck.
What to watch, and what it usually means
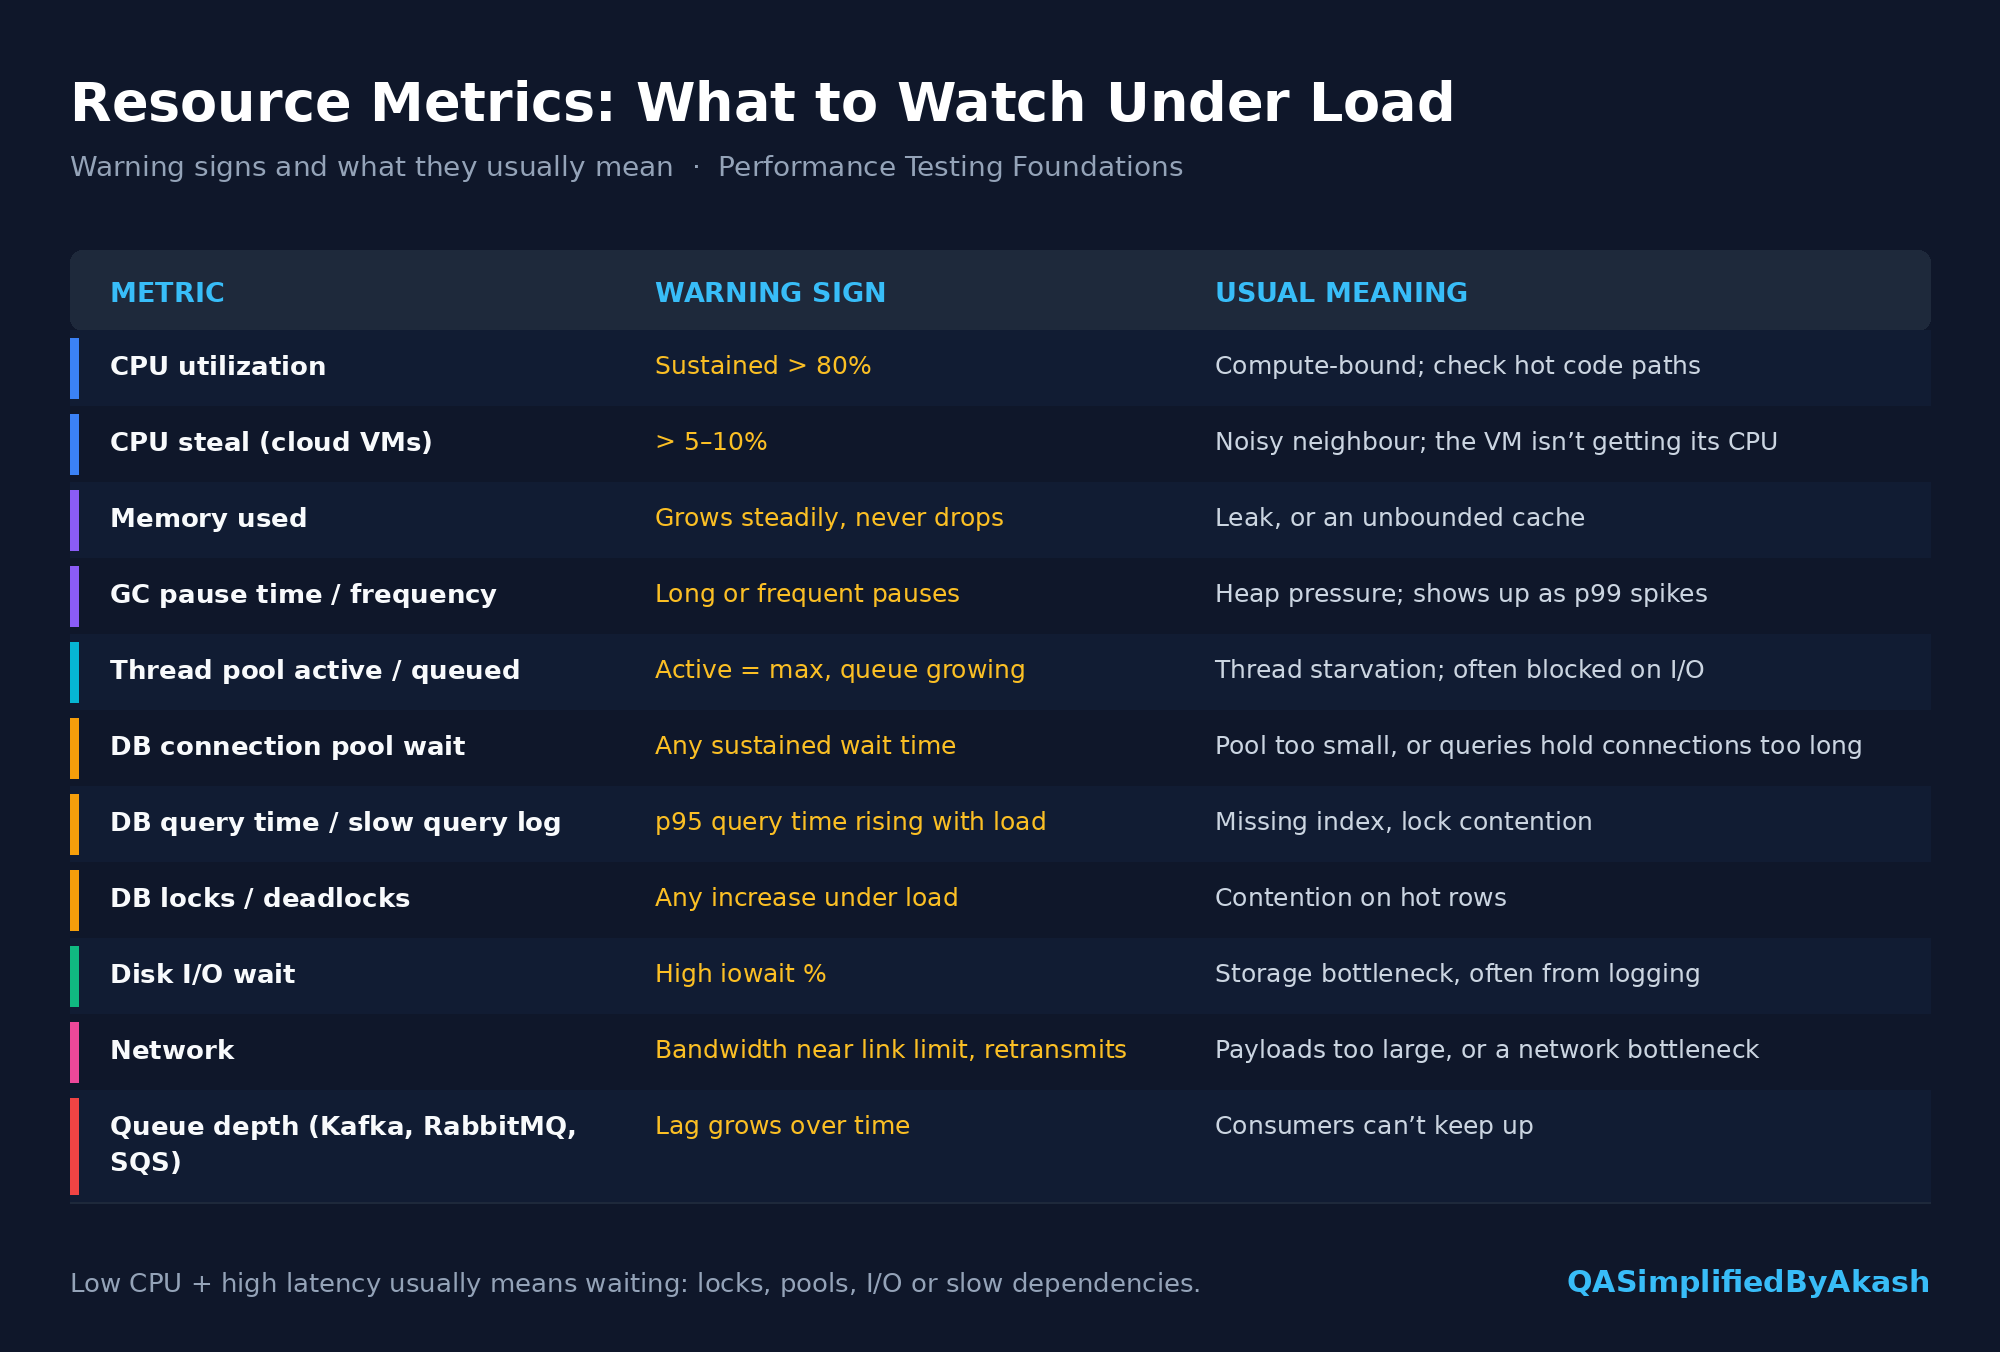
A note on CPU
Low CPU does not mean the system is healthy. If threads are all waiting on a database or a downstream API, CPU sits at 25% while users wait 6 seconds. Low CPU combined with high latency usually points to waiting: locks, pools, I/O or slow dependencies.
8. Front-End Metrics: What the Browser Experiences
API response time is only part of what the user sees. The browser still has to download, parse, render and become interactive.
Google’s Core Web Vitals are the standard set (thresholds are measured at the 75th percentile of page loads):

INP replaced FID (First Input Delay) as a Core Web Vital in 2024. If you see FID in older guides, it’s been retired.
Other useful ones: TTFB (server and network) and FCP (First Contentful Paint, when anything appears at all).
How QA can use these: Run Lighthouse or WebPageTest while a backend load test is running. A page that scores well on an idle system can fail LCP badly when the API behind it is under load. That combined view is rare, and it’s valuable.
9. Stability Metrics: Performance Over Time
A 10-minute test answers “Can it handle the load?” It doesn’t answer “Can it keep handling the load?”
In soak/endurance tests (several hours or more), watch for drift:
Memory climbing in a sawtooth pattern where each low point is higher than the last → leak
p95 latency slowly rising at constant load → growing tables, fragmented caches, accumulating state
Connection/file handle counts creeping up → resource leaks
Disk usage growing → logs or temp files never cleaned up
Error rate appearing only after hours → token expiry, certificate rotation, scheduled jobs colliding with traffic
The key signal: the same load should produce the same numbers at hour 1 and hour 8. If it doesn’t, something is accumulating.
10. Baselines, SLOs and Thresholds: Turning Numbers into Verdicts
A metric with nothing to compare against is just trivia. “p95 is 640 ms” is neither good nor bad until you compare it with something.
Baseline
Your last known-good result under the same load profile, test data and environment. It answers: “Did this build get worse?”
A regression of 640 ms → 900 ms on p95 is a finding even if 900 ms is technically “within SLA.”
SLO (Service Level Objective)
The target the team has agreed on, e.g. “99% of checkout requests complete under 1.5 s over 30 days.” It answers: “Is this good enough for users?”
Related terms you’ll hear:
SLI: the metric itself (checkout latency p99)
SLO: the internal target (p99 < 1.5 s)
SLA: the contractual promise to customers, usually looser than the SLO, with penalties attached
Error budget: how much failure the SLO allows. A 99.9% availability SLO allows about 43 minutes of failure per 30 days
Encode thresholds in the test itself
Don’t leave pass/fail to someone eyeballing a dashboard. Make the test fail automatically:
export const options = {
  scenarios: {
    checkout: {
      executor: 'constant-arrival-rate',
      rate: 200,
      timeUnit: '1s',
      duration: '15m',
      preAllocatedVUs: 100,
      maxVUs: 500,
    },
  },
  thresholds: {
    'http_req_duration{name:checkout}': ['p(95)<800', 'p(99)<1500'],
    'http_req_failed': ['rate<0.01'],
    'checks': ['rate>0.99'],
    'dropped_iterations': ['count==0'],
  },
};
This one config covers several ideas from this article:
Open model (arrival rate), which protects against coordinated omission
Per-transaction percentiles, not a blended average
Error rate and functional checks
Dropped iterations, which catch the case where the tool couldn’t sustain the target load
Wire this into CI and a performance regression fails the pipeline the same way a broken unit test does.
11. Putting It Together: Reading a Real Result
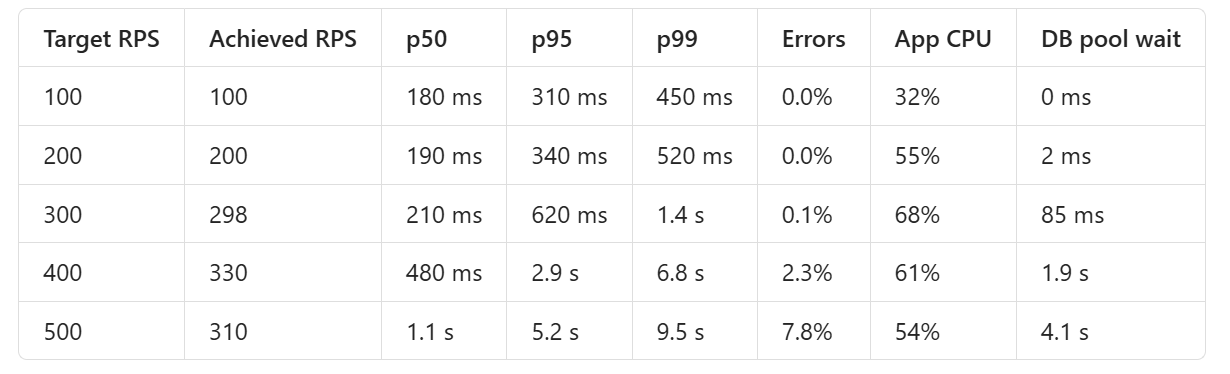
Here’s a step-load test on a checkout API. Load increases every 5 minutes.
How to read it:
100 → 200 RPS: Healthy. Throughput matches target, percentiles barely move. Plenty of headroom.
300 RPS: The knee. p50 barely changes, but p99 nearly triples. The tail always moves first. DB pool wait appears for the first time.
400 RPS: The system can’t keep up. Achieved throughput (330) is well below target (400), errors appear, and p99 hits 6.8 s.
500 RPS: Throughput drops to 310. Adding load now reduces useful work. That’s collapse.
The clue: CPU goes down after 300 RPS while latency explodes. The app isn’t busy, it’s waiting, and DB pool wait time confirms it.
Verdict: Safe capacity is about 250 RPS with the current SLO. The bottleneck is DB connections, either because the pool is too small or because queries hold connections too long. The next step is to check slow queries and connection hold time, not to add app servers. More app servers would just send more requests to the same exhausted pool.
That’s the difference between “the test failed at 400 users” and a finding a developer can act on.
12. Common Mistakes in Performance Reports
Reporting averages only
Blending all endpoints into one number
Ignoring achieved vs target throughput
Counting only HTTP status codes as errors
Testing from a load generator that is itself overloaded (check its CPU too)
Running against tiny test data. A 1,000-row table behaves nothing like a 50-million-row one
No warm-up period, so JIT compilation and cold caches skew the first minutes
Comparing runs with different environments, data or load profiles
Presenting metrics without a verdict. Always state: passed or failed, against what, and why
13. QA Checklist for Any Performance Test
Before the test
Target load defined in RPS/TPS, not just “users”
SLOs or baseline agreed per critical transaction
Open-model workload for user-facing traffic
Response checks beyond status codes
Production-like data volume
Monitoring ready: app, DB, infra and the load generator itself
During the test
Achieved rate matches target
Load generator CPU is under ~70%
Error timeline is being watched, not just the total
After the test
p50/p95/p99 per transaction
Goodput and error breakdown by type
Knee point identified
Bottleneck backed by resource metrics (USE)
Comparison with baseline
Clear verdict and next action
Interview Questions on This Topic
1. Why is average response time a poor metric for user experience? It hides the distribution. A few very slow requests and many fast ones can produce an average that matches no real user’s experience. Percentiles show what typical and tail users actually see.
2. Can you average p95 values from multiple load generators? No. Percentiles aren’t additive. You need to compute them from the combined raw samples or merged histograms.
3. What is coordinated omission? In a closed-model test, virtual users wait for responses before sending more requests. When the system stalls, fewer requests are sent, so the slow period is under-sampled and latency looks better than it is. Fix it by using arrival-rate (open) workloads and by checking achieved vs target throughput.
4. Explain Little’s Law and how you’d use it in test design. Concurrency = throughput × response time. It tells you how many virtual users or in-flight requests you need to generate a target RPS, and it explains why rising latency increases load on pools and threads.
5. Throughput stopped increasing but CPU is only 50%. What do you investigate? Something that waits rather than computes: DB connection pool, locks, thread pool limits, downstream dependencies, network or disk I/O. Look at saturation metrics such as pool wait time, queue lengths and thread states.
6. What’s the difference between throughput and goodput? Throughput counts all completed requests. Goodput counts only successful ones. Under stress, a system can show high throughput because it’s failing quickly.
7. Your test shows 0% errors. Are you confident the system is correct under load? Not unless the script validates response bodies. Systems can return 200 with empty, partial, stale or error payloads under load.
8. What’s the difference between SLI, SLO and SLA? SLI is the measured metric, SLO is the internal target for it, and SLA is the external contractual commitment, usually looser and with consequences attached.
9. What is the USE method? For every resource, check Utilization, Saturation and Errors. It’s a systematic way to find bottlenecks instead of guessing.
10. What would you look for in an 8-hour soak test that a 15-minute load test won’t show? Memory leaks, gradual latency drift, connection or file handle leaks, disk growth, and failures tied to time, such as token expiry or scheduled jobs.
11. What are Core Web Vitals and their “good” thresholds? LCP ≤ 2.5 s, INP ≤ 200 ms, CLS ≤ 0.1, measured at the 75th percentile. INP replaced FID in 2024.
12. Scenario: p50 is stable but p99 triples as load increases. What does that tell you? The system is approaching saturation. Queueing hits the tail first. You’re at or near the knee, so check pools, locks and GC before pushing more load.
13. How would you make performance testing part of CI/CD? Run a short, targeted load test on critical endpoints with thresholds encoded in the script (percentiles, error rate, checks), fail the pipeline on breach, and compare against a stored baseline to catch regressions.
Final Thought
Performance metrics aren’t a dashboard to screenshot. They’re evidence.
A good performance QA doesn’t just report that p99 went up. They explain where it went up, at what load, which resource saturated, and what the team should do next.
Learn to read the metrics together, and your reports will start driving fixes instead of just getting filed.
Share this article
Found this useful? Share it with another QA engineer.
Keep learning